
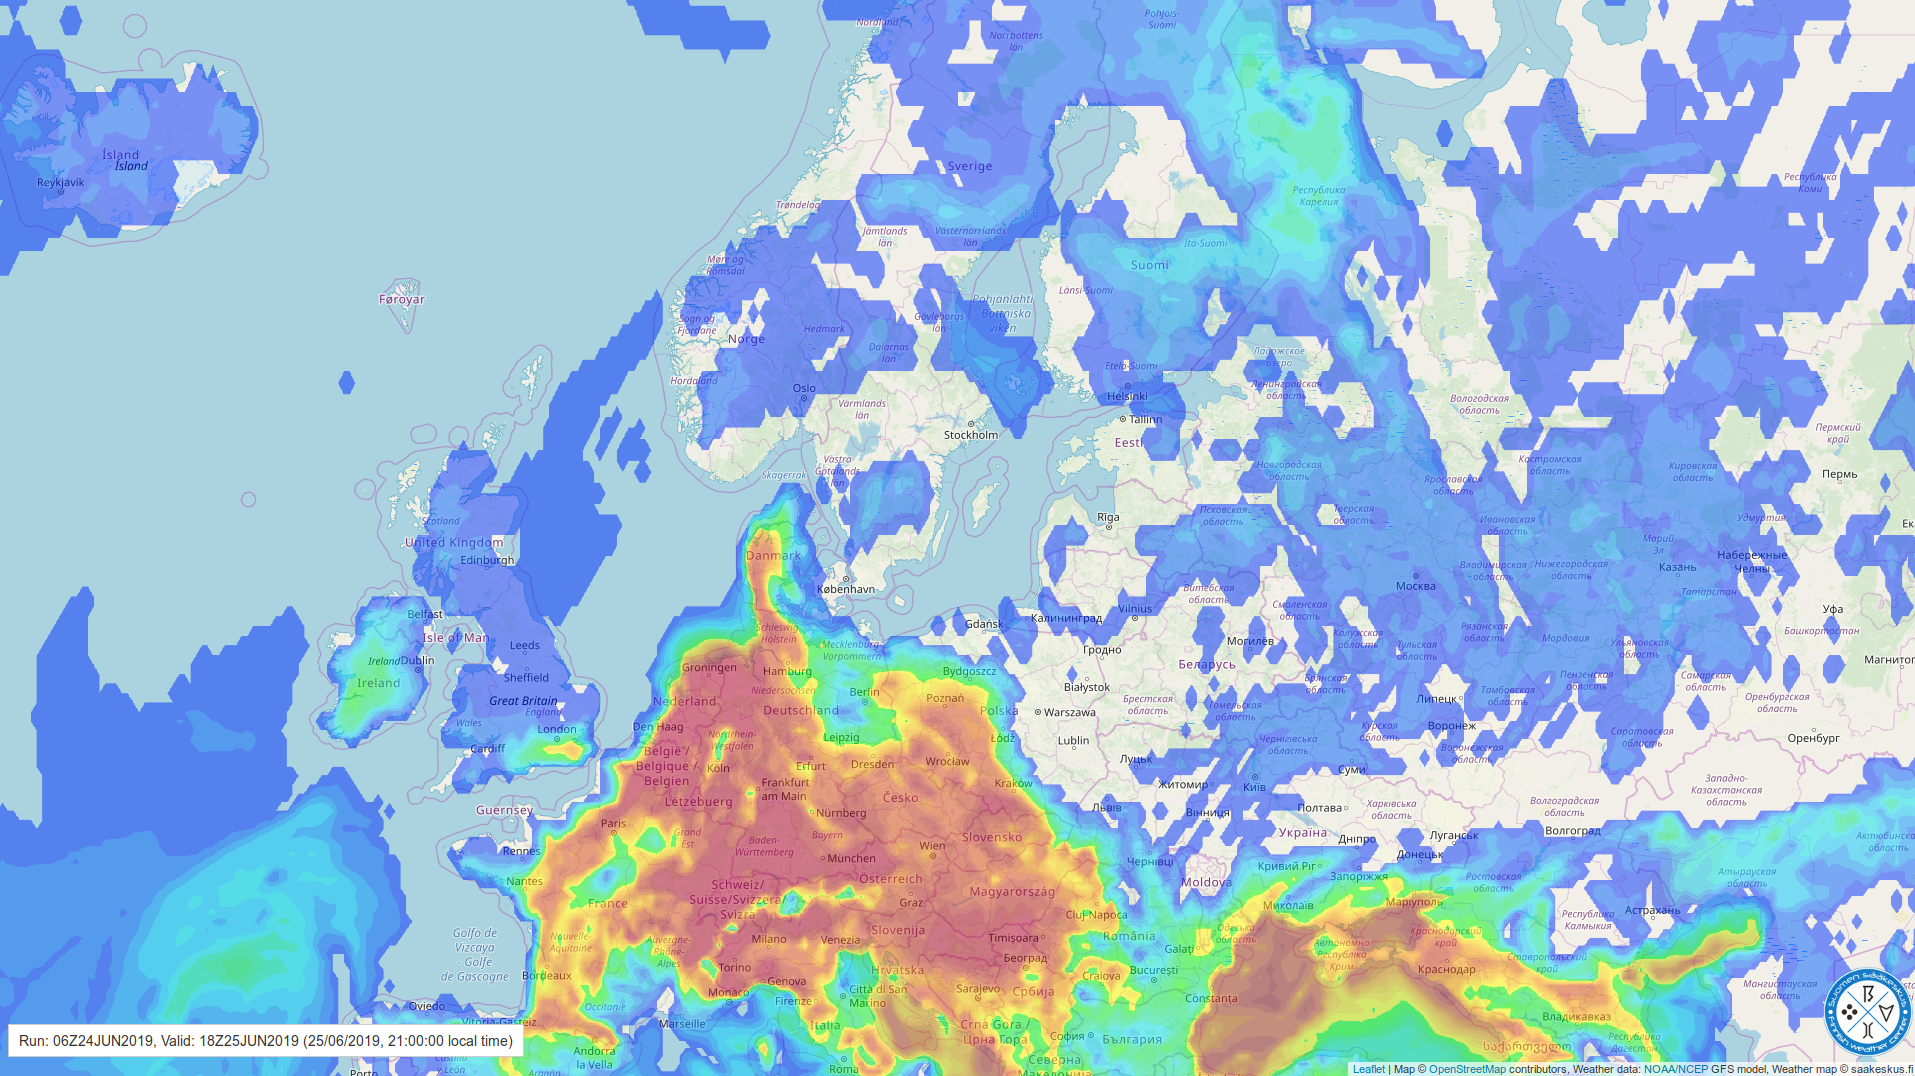
GFS working again
The network connection to the NOAA datacenter is working fine again since a week or so, so I took the restriction off. Charts are as usual being rendered every six hours.
We provide free, up-to-date, high resolution weather charts of Finland, the Nordic countries and Europe, for storm chasers and other people interested in weather forecasting.


The network connection to the NOAA datacenter is working fine again since a week or so, so I took the restriction off. Charts are as usual being rendered every six hours.
The NOAA datacenter seems to have some problems leading to very slow transfers and response times for the GFS datasets. The download partially takes more than 6 hours which means, there's sometimes 2 or more rendering instances running at the same time. Until the problems in the NOAA datacenter are fixed, I will restrict download and redering on the main Saakeskus site to the 18Z run only. At the moment, I'm not restricting the beta site as it doesn't have as complex charts yet and requires much less data download.
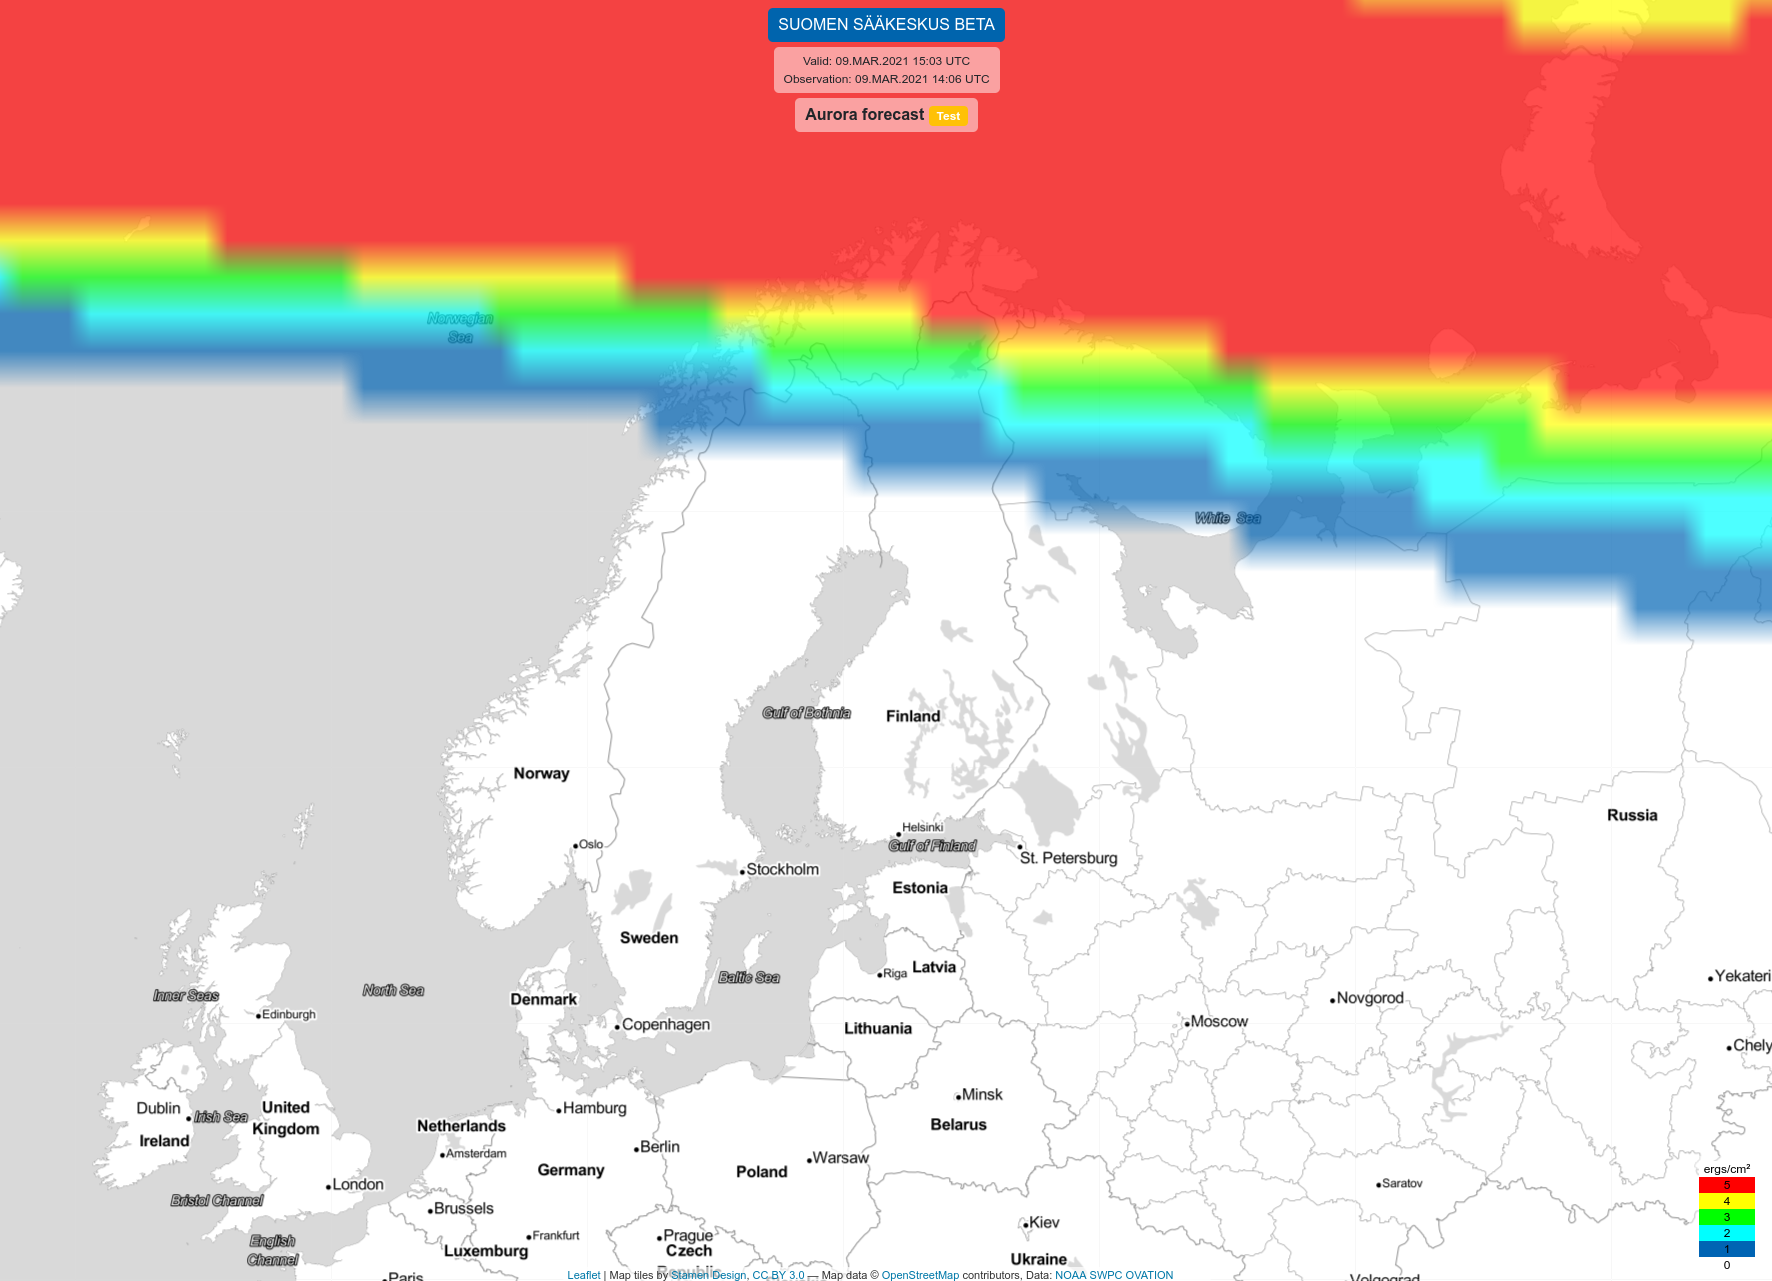
Check it out on the beta page at https://beta.saakeskus.fi/ ! To see the forecast, choose it from the list of layers on the right. The forecast is updated on the server every 5 minutes and will be automatically refreshed on the map. The forecast map is based on the NOAA SWPC OVATION short term forecast model which produces forecasts from 30 to 90 minutes into the future.
As part of the development, the beta app has moved to it's own domain: https://beta.saakeskus.fi/. Please update your links.
